
Glaucoma Imaging Modality Comparison Tool
This tool helps clinicians compare the key features, strengths, and limitations of the three major imaging modalities used in glaucoma diagnosis: Optical Coherence Tomography (OCT), Heidelberg Retina Tomograph (HRT), and Scanning Laser Polarimetry (SLP).
OCT
Optical Coherence Tomography
HRT
Heidelberg Retina Tomograph
SLP
Scanning Laser Polarimetry
| Feature | OCT | HRT | SLP |
|---|---|---|---|
| Primary Metric | RNFL & GCC thickness | Optic disc topography, CDR | RNFL birefringence |
| Resolution | ≈5 µm | ≈15 µm | ≈10 µm |
| Acquisition Time | 1–2 seconds | 2–3 seconds | 1–2 seconds |
| Strengths | High repeatability, quantitative maps | Detailed disc shape, good for CDR trends | Early RNFL loss detection, useful when OCT not available |
| Limitations | Signal loss in media opacity | Requires good focus; less intuitive for non-specialists | Susceptible to ocular birefringence artifacts |
Key Considerations
For patients with early glaucoma or borderline findings, OCT often provides the most detailed structural assessment. When media opacity (cataracts, corneal issues) affects OCT imaging, SLP can be valuable. HRT excels for monitoring CDR trends over time in established glaucoma.
The best choice often depends on your specific clinical question: structural changes? CDR progression? Early RNFL loss? Always combine imaging findings with visual field tests and clinical judgment.
Clinical Recommendation
Use OCT as your primary imaging modality for glaucoma assessment. Supplement with HRT for detailed topographic analysis of the optic disc, and SLP when OCT results are ambiguous or unavailable due to media opacity. Remember, no single modality provides the complete picture—combine findings with visual field testing for maximum diagnostic confidence.
Key Takeaways
- optic nerve imaging provides objective, repeatable data that catches glaucoma earlier than pressure checks alone.
- Optical Coherence Tomography (OCT) is the current workhorse, offering micrometer‑level detail of the retinal nerve fiber layer.
- Combining imaging with visual‑field testing and intraocular pressure measurement gives the highest diagnostic confidence.
- Understanding each modality’s strengths-OCT for thickness, HRT for topography, SLP for birefringence-helps tailor follow‑up schedules.
- Regular imaging tracks disease progression, informing timely treatment adjustments.
Why Imaging Matters in Open‑Angle Glaucoma
Open‑angle glaucoma (OAG) often sneaks up on patients. The pressure in the eye may rise slowly, and many people feel no symptoms until vision loss is noticeable. That's why clinicians rely on more than just a pressure reading.
Enter optic nerve imaging is a set of non‑invasive techniques that capture detailed pictures of the optic nerve head and the surrounding retinal layers. By visualising subtle structural changes, imaging catches disease before functional loss appears on a visual‑field test.
When you pair imaging with intraocular pressure (IOP) measurements, visual‑field testing, and a thorough optic‑disc exam, you get a multi‑dimensional view of the eye’s health. This layered approach reduces missed diagnoses and guides treatment timing.
Core Imaging Modalities
Several technologies dominate the glaucoma‑imaging landscape. Each shines a light on a different part of the optic nerve complex.
Optical Coherence Tomography (OCT) uses low‑coherence light to generate cross‑sectional images of the retina. It maps the retinal nerve fiber layer (RNFL) thickness and the ganglion cell complex (GCC) with micrometer precision.
Heidelberg Retina Tomograph (HRT) employs confocal scanning laser ophthalmoscopy to create a three‑dimensional topography of the optic disc. It excels at measuring cup‑to‑disc ratio (CDR) changes over time.
Scanning Laser Polarimetry (SLP) detects the birefringent properties of the RNFL. Changes in polarization signal indicate thinning, even before a drop in thickness is measurable.
Below is a side‑by‑side comparison that helps decide which tool fits a given practice.
| Feature | OCT | HRT | SLP |
|---|---|---|---|
| Primary Metric | RNFL & GCC thickness | Optic disc topography, CDR | RNFL birefringence |
| Resolution | ≈5 µm | ≈15 µm | ≈10 µm |
| Acquisition Time | 1-2 seconds | 2-3 seconds | 1-2 seconds |
| Strengths | High repeatability, quantitative maps | Detailed disc shape, good for CDR trends | d>Early RNFL loss detection, useful when OCT not available|
| Limitations | Signal loss in media opacity | Requires good focus; less intuitive for non‑specialists | Susceptible to ocular birefringence artifacts |
How to Integrate Imaging into a Diagnostic Workflow
- Start with a comprehensive history and IOP measurement.
- Perform a dilated fundus exam to assess the optic disc’s appearance.
- Order an OCT scan of the RNFL and GCC. Look for localized thinning that matches the pattern of early glaucomatous loss (e.g., inferior or superior arcuate defects).
- If OCT results are borderline or media opacity hampers the view, consider HRT or SLP as adjuncts.
- Schedule a standard automated perimetry (visual‑field test). Correlate structural defects on imaging with functional loss on the field map.
- Document baseline images and repeat imaging every 6-12 months, depending on disease severity and progression risk.
By following this sequence, clinicians catch structural changes before they become symptomatic, giving patients a better shot at preserving vision.
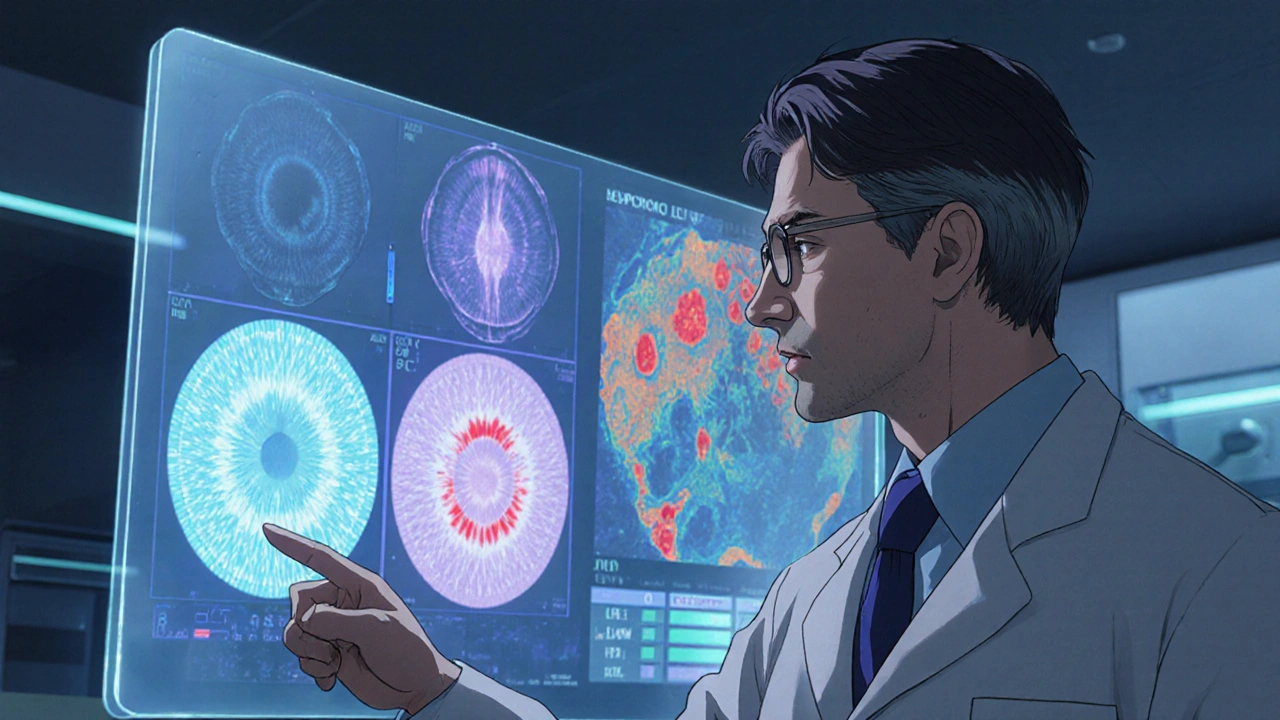
Interpreting OCT Findings in Open‑Angle Glaucoma
OCT outputs include color‑coded maps, numeric averages, and deviation plots. Here’s how to read them effectively:
- RNFL Thickness: Normal average is around 90 µm. Values below 75 µm, especially if asymmetric between superior and inferior quadrants, raise red flags.
- GCC Analysis: The ganglion cell layer thins early in glaucoma. A GCC loss of >10 % compared to age‑matched norms often signals disease.
- Sector Analysis: Look for focal dips rather than a uniform thinning-this pattern aligns with typical glaucomatous damage.
Always compare the eye’s data against its fellow eye and against a database of healthy eyes of similar age. Discrepancies between eyes can be a tell‑tale sign.
Case Study: Early Detection Fueled by Imaging
Mrs. Patel, 58, came for a routine check‑up. Her IOP was 16 mmHg-within normal range. A standard exam showed a slightly enlarged cup, but nothing conclusive. OCT revealed a localized inferotemporal RNFL thinning of 68 µm, well below her fellow eye’s 92 µm. Visual‑field testing later confirmed a subtle scotoma matching the OCT defect.
Because the imaging caught the problem early, her ophthalmologist started a prostaglandin analogue, and follow‑up scans over the next year showed stable RNFL thickness. Mrs. Patel avoided progressive vision loss, illustrating how imaging can turn a silent disease into a manageable condition.
Common Pitfalls and How to Avoid Them
Even the best tools can mislead if misused. Keep an eye on these traps:
- Over‑reliance on a single metric: RNFL thinning may be caused by optic neuropathies unrelated to glaucoma. Correlate with clinical exam and visual fields.
- Ignoring scan quality: Low signal strength (<7/10) can produce false‑positive thinning. Re‑scan or use an alternative modality.
- Missing progressive trends: One‑off measurements can be noisy. Use longitudinal analysis software to spot true change.
- Failing to account for age‑related thinning: RNFL naturally thins with age. Compare against age‑matched normative databases, not a single static cutoff.
Future Directions: AI‑Assisted Imaging
Artificial intelligence is reshaping how we interpret optic‑nerve images. Deep‑learning models trained on thousands of OCT scans can flag subtle patterns invisible to the human eye. Early pilots show AI‑derived risk scores predict conversion to glaucoma up to two years sooner than traditional analysis.
In the next few years, we can expect integrated AI tools within OCT devices that provide instant, evidence‑based recommendations-essentially a second set of eyes that never tires.
Bottom Line
Optic nerve imaging is no longer a luxury; it’s a cornerstone of modern glaucoma care. By delivering objective, high‑resolution snapshots of the optic disc and retinal layers, it empowers clinicians to diagnose earlier, track progression accurately, and tailor treatments to each patient’s unique trajectory.
Frequently Asked Questions
What is the primary benefit of OCT over traditional fundus photography?
OCT provides quantitative thickness measurements of the retinal nerve fiber layer and ganglion cell complex, allowing detection of microscopic changes that photographs cannot reveal.
How often should a patient with early open‑angle glaucoma undergo imaging?
For early disease, a repeat scan every 6-12 months is typical. The exact interval depends on progression risk factors such as baseline RNFL thickness and IOP control.
Can optic nerve imaging replace visual‑field testing?
No. Imaging shows structural loss, while visual‑field testing captures functional deficits. The best practice combines both to confirm diagnosis and monitor change.
What does a high cup‑to‑disc ratio indicate?
A larger cup‑to‑disc ratio can signal loss of neuro‑retinal tissue, a hallmark of glaucoma. However, some individuals naturally have larger cups, so baseline imaging is essential for comparison.
Are there any risks associated with OCT scans?
OCT uses harmless near‑infrared light, so there are no known risks. It’s non‑contact and painless, making it suitable for repeated use.
How does AI improve glaucoma detection in imaging?
AI algorithms analyze patterns across thousands of scans, flagging subtle changes and generating risk scores that can predict disease progression earlier than human interpretation alone.
Is optic nerve imaging covered by health insurance in the UK?
Most NHS trusts provide OCT and related imaging for suspected glaucoma when referred by a specialist. Private insurers typically cover it if deemed medically necessary.
15 Responses
Optic nerve imaging, particularly OCT, offers a reproducible metric that can be quantified across visits, enabling clinicians to detect subtle RNFL thinning before visual field loss emerges.
The reliance on structural data challenges the traditional pressure‑centric paradigm, urging us to view glaucoma as a neurodegenerative process rather than merely an intraocular pressure issue.
Honestly, if you think OCT alone will catch everything, you’re living in a fantasy. The literature is saturated with cases where RNFL thickness looks fine, yet patients still progress.
Such optimism neglects the fact that imaging modalities have inherent limitations: media opacity can corrupt OCT signals, and HRT's topographic data often suffer from inter‑operator variability.
i totally get how overwhelming all these numbers can be, but the key is to focus on trends over time rather than a single scan, it really helps patients feel less lost.
While trends matter, a lazy reliance on any single metric without proper quality control risks misdiagnosis, especially when signal strength dips below acceptable thresholds.
Great summary!
When we examine the broader context, it becomes evident that the dominant narrative surrounding optic nerve imaging is a constructed façade designed to veil the deeper, more insidious forces at play. The corporate interests that fund the development of OCT devices have a vested stake in perpetuating a technology‑centric view, ensuring continuous revenue streams while marginalizing alternative, perhaps more holistic, diagnostic approaches. Moreover, the regulatory bodies, often complicit through their funding mechanisms, rarely challenge the prevailing dogma, allowing a feedback loop that reinforces the illusion of progress. This isn’t merely about medical devices; it’s an orchestrated symphony of data manipulation, selective publishing, and a subtle coercion of clinicians into adopting a monolithic standard of care. Every time a new generation of OCT machines hits the market, the marketing departments unleash a barrage of “clinical breakthrough” white papers, yet the underlying evidence remains thin, heavily weighted toward short‑term outcomes. The consequence is a gradual erosion of critical thinking, as practitioners become dependent on glossy images rather than patient narratives. In parallel, the commodification of imaging data fuels an ecosystem where insurance reimbursements are tied to the frequency of scans, incentivizing quantity over quality. Consequently, the patient’s lived experience becomes secondary to a metric that can be easily monetized. It’s a subtle yet pervasive shift, one that redefines what we consider as “standard of care” based not on holistic well‑being but on profitability. The broader implication is a healthcare landscape where technology is wielded as a gatekeeper, filtering out dissenting voices and dictating the parameters of acceptable practice. Ultimately, the real danger lies not in the technology itself, but in the sociopolitical machinery that surrounds it, shaping policies, research agendas, and clinical habits in ways that serve power structures rather than patient health.
Your exposé highlights valid concerns, yet the practical reality remains that most clinicians lack viable alternatives to OCT for early detection, making it an indispensable tool despite its flaws.
Stay positive! Consistent imaging follow‑ups can dramatically improve long‑term visual outcomes for patients.
the truth is that imaging only scratches the surface of a deeper physiological mystery a mere glance at RNFL thickness cannot capture the complex interplay of vascular, metabolic, and neurogenic factors at work
From a data‑centric perspective, the diagnostic yield of OCT in isolation is statistically suboptimal; integrating multimodal metrics-such as peripapillary capillary density via OCT‑angiography-significantly augments predictive accuracy.
you think the numbers speak for themselves but they mask the patient’s subjective experience which is often dismissed in favor of cold, hard measurements
In mentoring junior clinicians, I emphasize the importance of correlating imaging findings with comprehensive clinical assessment to avoid overreliance on any single diagnostic modality.
Thus, a balanced, evidence‑based approach that synthesizes structural imaging, functional testing, and patient history remains the cornerstone of optimal glaucoma management.